dow jones industrial average index graph on iphone 4 - dow chart stock pictures, royalty-free photos & imagesDow Jones Industrial Average Index graph on iPhone 4Stock Market, Stock Price, Chart
The Dow Jones stock chart is displayed on a tablet screen. The Dow Jones Industrial Average closes above the 50,000 mark for the first time ever,...Dow Jones - S&P Global - US Stock Index - Photo IllustrationInvestment, Dow Jones Industrial Average
Trader works on the floor of the New York Stock Exchange as a chart shows the downward track of the S&P 500 Index during afternoon trading February...Markets Closes At Low Not Seen Since May 1997Chart, Moving Down, Trading
Trader looks on in front of a chart showing the downward trend of the Dow Jones Industrial Average at the New York Stock Exchange at the end of the...Dow Drops Below 7000 For First Time In 12 YearsChart, Stock Market, Dow Jones Industrial Average
Dow Jones index graphs are seen reflected in a man's glasses in this illustration photo in Warsaw, Poland on 10 June, 2023. Global growth has slowed...Global Economy On Precarious Footing Amid High Interest RatesStock Market, Economy, Trading
dow jones industrial average index chart on ipad2 - dow chart stock pictures, royalty-free photos & imagesDow Jones Industrial Average Index chart on iPad2Stock Market, Graph, Chart
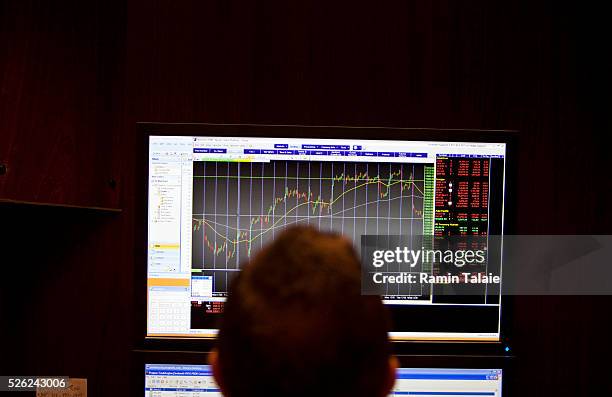
Trader monitors stock activities on a computer screen on the floor of the New York Stock Exchange in New York City, on Wednesday, August 11, 2010....The Dow Jones Industrials Lost 2.5% Following Poor Economic ReportsStock Market, Chart
Dow Jones index graphs are seen reflected in a man's glasses in this illustration photo in Warsaw, Poland on 10 June, 2023. Global growth has slowed...Global Economy On Precarious Footing Amid High Interest RatesStock Market
Dow Jones index graphs are seen reflected in a man's glasses in this illustration photo in Warsaw, Poland on 10 June, 2023. Global growth has slowed...Global Economy On Precarious Footing Amid High Interest RatesStock Market, Privacy, Reflection
Chart of the S&P 500 Index, upper right, is displayed on a computer sceen on the floor of the New York Stock Exchange in New York, U.S., on Thursday,...Dow Average Plunges The Most Since 1987 Before Paring LossesStock Market, Chart, USA
Assistant coach Ron Rothstein of the Miami Heat diagrams a play for Marcus Banks during the game against the New Jersey Nets at the IZOD Center on...Miami Heat v New Jersey Nets
Symbol photo on the topics Dow Jones, stock exchange, US-Dollar, economy, world economy, etc. The photo shows the word Dow Jones on a stock price...Symbol photo on the topics Dow Jones, stock exchange, US-Dollar, economy, world economy, etc.
Symbol photo on the topics Dow Jones, stock exchange, US-Dollar, economy, world economy, etc. The photo shows the word Dow Jones on a stock price...Symbol photo on the topics Dow Jones, stock exchange, US-Dollar, economy, world economy, etc.
Symbol photo on the topics Dow Jones, stock exchange, US-Dollar, economy, world economy, etc. The photo shows the word Dow Jones on a stock price...Symbol photo on the topics Dow Jones, stock exchange, US-Dollar, economy, world economy, etc.
Symbol photo on the topics Dow Jones, stock exchange, US-Dollar, economy, world economy, etc. The photo shows the word Dow Jones on a stock price...Symbol photo on the topics Dow Jones, stock exchange, US-Dollar, economy, world economy, etc.
Pedestrian passes before a share prices chart at downtown Tokyo 17 March 2006. Japanese share prices rose 243.52 points to close at 16,339.73 points...A pedestrian passes before a share price
An investor gazes at a share prices chart at downtown Tokyo 17 March 2006. Japanese share prices rose 243.52 points to close at 16,339.73 points at...An investor gazes at a share prices char
dow jones industrial average on iphone - dow chart stock pictures, royalty-free photos & imagesDow Jones Industrial Average on iPhone
dow jones industrial average on iphone - dow chart stock pictures, royalty-free photos & imagesDow Jones Industrial Average on iPhone
dow jones industrial average - dow chart stock pictures, royalty-free photos & imagesDow Jones Industrial AverageStock Market
dow jones - dow chart stock pictures, royalty-free photos & imagesDow JonesToronto Stock Exchange, Dow Jones Industrial Average, Stock Market
dow jones industrial average - dow chart stock pictures, royalty-free photos & imagesDow Jones Industrial Average
dow jones industrial average - dow chart stock pictures, royalty-free photos & imagesDow Jones Industrial AverageDow Jones Industrial Average, Stock Market, Opportunity
dow jones industrial average - dow chart stock pictures, royalty-free photos & imagesDow Jones Industrial AverageDow Jones Industrial Average, Industry
dow jones industrial average index chart on ipad2 - dow chart stock pictures, royalty-free photos & imagesDow Jones Industrial Average Index chart on iPad2Digital Tablet, iPad, Device Screen
In this photo illustration, a hand holds a smartphone displaying a declining Nasdaq Composite index chart in front of a predominantly red Nasdaq...US Stocks Plunge As AI Selloff Intensifies
In this photo illustration, a hand holds a smartphone displaying declines in the S&P 500, Nasdaq Composite and Dow Jones Industrial Average,...US Stocks Plunge As AI Selloff Intensifies
In this photo illustration, a hand holds a smartphone displaying a declining S&P 500 index chart in front of a predominantly red S&P 500 stock market...US Stocks Plunge As AI Selloff Intensifies
Hand holds a smartphone displaying the Dow Jones logo, with a stock market chart showing a downward trend on trading screens in the background in...TUNISIA-ILLUSTRATION-DOW-JONES-STOCK-MARKET
Hand holds a smartphone displaying the Dow Jones logo, while a stock market chart with a rising green line and upward trend appears on trading...TUNISIA-ILLUSTRATION-DOW-JONES-STOCK-MARKET
Hand holds a smartphone displaying the Dow Jones logo, with financial charts and trading screens visible in the background in Tunis,Tunisia on...TUNISIA-ILLUSTRATION-DOW-JONES-STOCK-MARKET
In this photo illustration, a smartphone displays the logo of Dow Inc. , an American materials science company producing chemicals, plastics and...Dow Logo Shown on Smartphone with Latest Stock Market Chart
Charts showing the the Dow Jones Industrial Average, S&P 500 and Nasdaq Composite Index as of March 16.US-STOCKS-MARKETS-CLOSE
Charts showing the the Dow Jones Industrial Average, S&P 500 and Nasdaq Composite Index as of February 25.US-STOCKS-MARKETS-CLOSE
Chart showing Dow Jones S&P500 index performance from Jan 2015 - Jan 2025US-POLITICS-GOVERNMENT-MARKETS
In this photo illustration, a smartphone displays the logo of Dow Inc. , a U.S.-based materials science company, in front of a screen showing the...Dow Logo Displayed on Smartphone with Latest Stock Market Chart
The Dow Jones stock chart is displayed on a mobile screen. The Dow Jones Industrial Average closes above the 50,000 mark for the first time ever in...Dow Jones - S&P Global - US Stock Index - Photo IllustrationStock Price, Stock Market
The Dow Jones stock chart is displayed on a mobile screen. The Dow Jones Industrial Average closes above the 50,000 mark for the first time ever in...Dow Jones - S&P Global - US Stock Index - Photo IllustrationUSA, NASDAQ, Stock Market
investment markets editable stroke icons set with etf, ipo, s&p 500, dow jones, forex, commodities, crypto, and portfolio strategy symbols for finance trading apps, dashboards, and reports - dow chart stock illustrationsInvestment Markets Editable Stroke Icons Set With ETF, IPO, S&P 500, Dow Jones, Forex, Commodities, Crypto, And Portfolio Strategy Symbols For Finance Trading Apps, Dashboards, And Reports
investment markets black icons set with etf, ipo, s&p 500, dow jones, forex, commodities, crypto, and portfolio strategy symbols for finance trading apps, dashboards, and reports - dow chart stock illustrationsInvestment Markets Black Icons Set With ETF, IPO, S&P 500, Dow Jones, Forex, Commodities, Crypto, And Portfolio Strategy Symbols For Finance Trading Apps, Dashboards, And ReportsData, Bull Market, Stock Price
See a unique visual breakdown of the global equity market in this infographic, with a focus on the SP 500's size. Data Source: SP Dow Jones Indices.The S&P 500 Makes Up 51% of Global Stock Market Value
Dow Jones Industrial Average chart on the floor of the New York Stock Exchange in New York, US, on Wednesday, March 19, 2025. Federal Reserve...Traders On The Floor Of The New York Stock Exchange As Fed Chair Powell Holds New ConferenceDow Jones Industrial Average
The Dow Jones Industrial Average logo appears on a smartphone screen in this illustration photo in Reno, United States, on December 17, 2024.Dow Jones Falls More Than 260 Points
The Dow Jones Industrial Average logo appears on a smartphone screen in this illustration photo in Reno, United States, on December 17, 2024.Dow Jones Falls More Than 260 Points
The Dow Jones Industrial Average logo appears on a smartphone screen in this illustration photo in Reno, United States, on December 17, 2024.Dow Jones Falls More Than 260 Points
The Dow Jones Industrial Average logo appears on a smartphone screen in this illustration photo in Reno, United States, on December 17, 2024.Dow Jones Falls More Than 260 Points
We visualized over 20 years of stock market history to see how many active funds were able to beat the S&P 500. Data Source: S&P Dow Jones Indices.Infographic: How Many Active Funds Beat the S&P 500?
Among all sectors, Amazon makes up the greatest share of their sector, accounting for 39% of the Consumer Discretionary sector. Data source: S&P Dow...Charted: The Largest Company in Every Sector of the S&P 500
In this photo illustration, the American stock market index of the 30 prominent companies Dow Jones Industrial Average logo seen displayed on a...In this photo illustration, the American stock market index
In this photo illustration, the American chemical producer Dow Inc logo seen displayed on a smartphone with an economic stock exchange index graph in...In this photo illustration, the American chemical producer
This graphic illustrates the biggest stock markets by country, providing a unique breakdown of $110 trillion in valuation. Data source: S&P Dow Jones...The World's Biggest Stock Markets, by Country
This chart visualize's 2020's most resilient assets, along with the strength of their recovery. Data source: XAGUSD, XAUUSD, Russell 2000, S&P 500,...How Every Asset Class, Currency, and S&P 500 Sector Performed in 2020
Chart shows the market gains on the floor of the New York Stock Exchange after the closing bell on May 3, 2013 in New York City. The Dow Jones...U.S. Forces Prepare To Withdraw From Iraq After 8-Year PresenceStock Market, New York City
Col x 12.75 in / 196x324 mm / 667x1102 pixels Doug Griswold color illustration of economic survivors floating away on balloons to escape a fever...Market Crash
And P 500 and Dow Jones indexes are seen mobile device application in this illustration photo taken in Warsaw, Poland on 29 August, 2023.Stock Market And Cryptocurrency IllustrationsLaptop, Investment