World Map Land Surface Temperature Anomaly May 2024 - stock illustration
World Map Land Surface Temperature Anomaly May 2024. Miller Cylindrical Projection.
Land surface temperature anomalies for the month of May 2024 compared to the average conditions during that period between 2001-2010.
All source data is in the public domain.
Color texture: MODIS Terra satellite data courtesy of NASA Earth Observations.
https://neo.gsfc.nasa.gov/view.php?datasetId=MOD_LSTAD_M

Get this image in a variety of framing options at Photos.com.
PURCHASE A LICENCE
All Royalty-Free licences include global use rights, comprehensive protection, and simple pricing with volume discounts available
£275.00
GBP
Getty ImagesWorld Map Land Surface Temperature Anomaly May 2024 High-Res Vector Graphic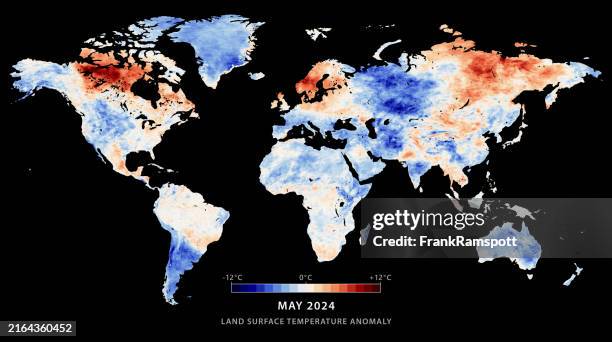 Download premium, authentic World Map Land Surface Temperature Anomaly May 2024 stock illustrations from Getty Images. Explore similar high-resolution stock illustrations in our expansive visual catalogue.Product #:2164360452
Download premium, authentic World Map Land Surface Temperature Anomaly May 2024 stock illustrations from Getty Images. Explore similar high-resolution stock illustrations in our expansive visual catalogue.Product #:2164360452£275£50
Getty Images
In stockDETAILS
Credit:
Creative #:
2164360452
Licence type:
Collection:
DigitalVision Vectors
Max file size:
7700 x 4300 px (165.75 x 92.56 cm) - 118 dpi - 7 MB
Upload date:
Release info:
No release required
Categories:
- Heat - Temperature,
- Map,
- 2024,
- Aerial View,
- Black Colour,
- Blue,
- Calendar Date,
- Cartography,
- Change,
- Climate,
- Climate Change,
- Cold Temperature,
- Colour Image,
- Computer Graphic,
- Contrasts,
- Design,
- Digital Composite,
- Digitally Generated Image,
- Global,
- Horizontal,
- Illustration,
- Infographic,
- May,
- Month,
- No People,
- Overhead View,
- Physical Geography,
- Red,
- Satellite View,
- Science,
- Social Issues,
- Temperature,
- Variation,
- World Map,